Deep Dives
Visualizing LLM Performance through Monitoring Dashboards
Monitoring dashboards transform complex telemetry into clear insights on system health and performance.

Monitoring dashboards serve as central visual displays that provide past and present data about the functionality, health, and performance of applications, infrastructure, and software systems. They provide a quick and thorough overview of system behavior by combining several metrics, logs, and traces into understandable charts, graphs, and tables. A monitoring dashboard's main function is to convert complicated, unprocessed telemetry data into useful information that technical teams can comprehend and respond to with ease. A well-designed dashboard enables engineers, operations personnel, and even product managers to rapidly evaluate the condition of the system at a glance rather than searching through many log files or querying databases.
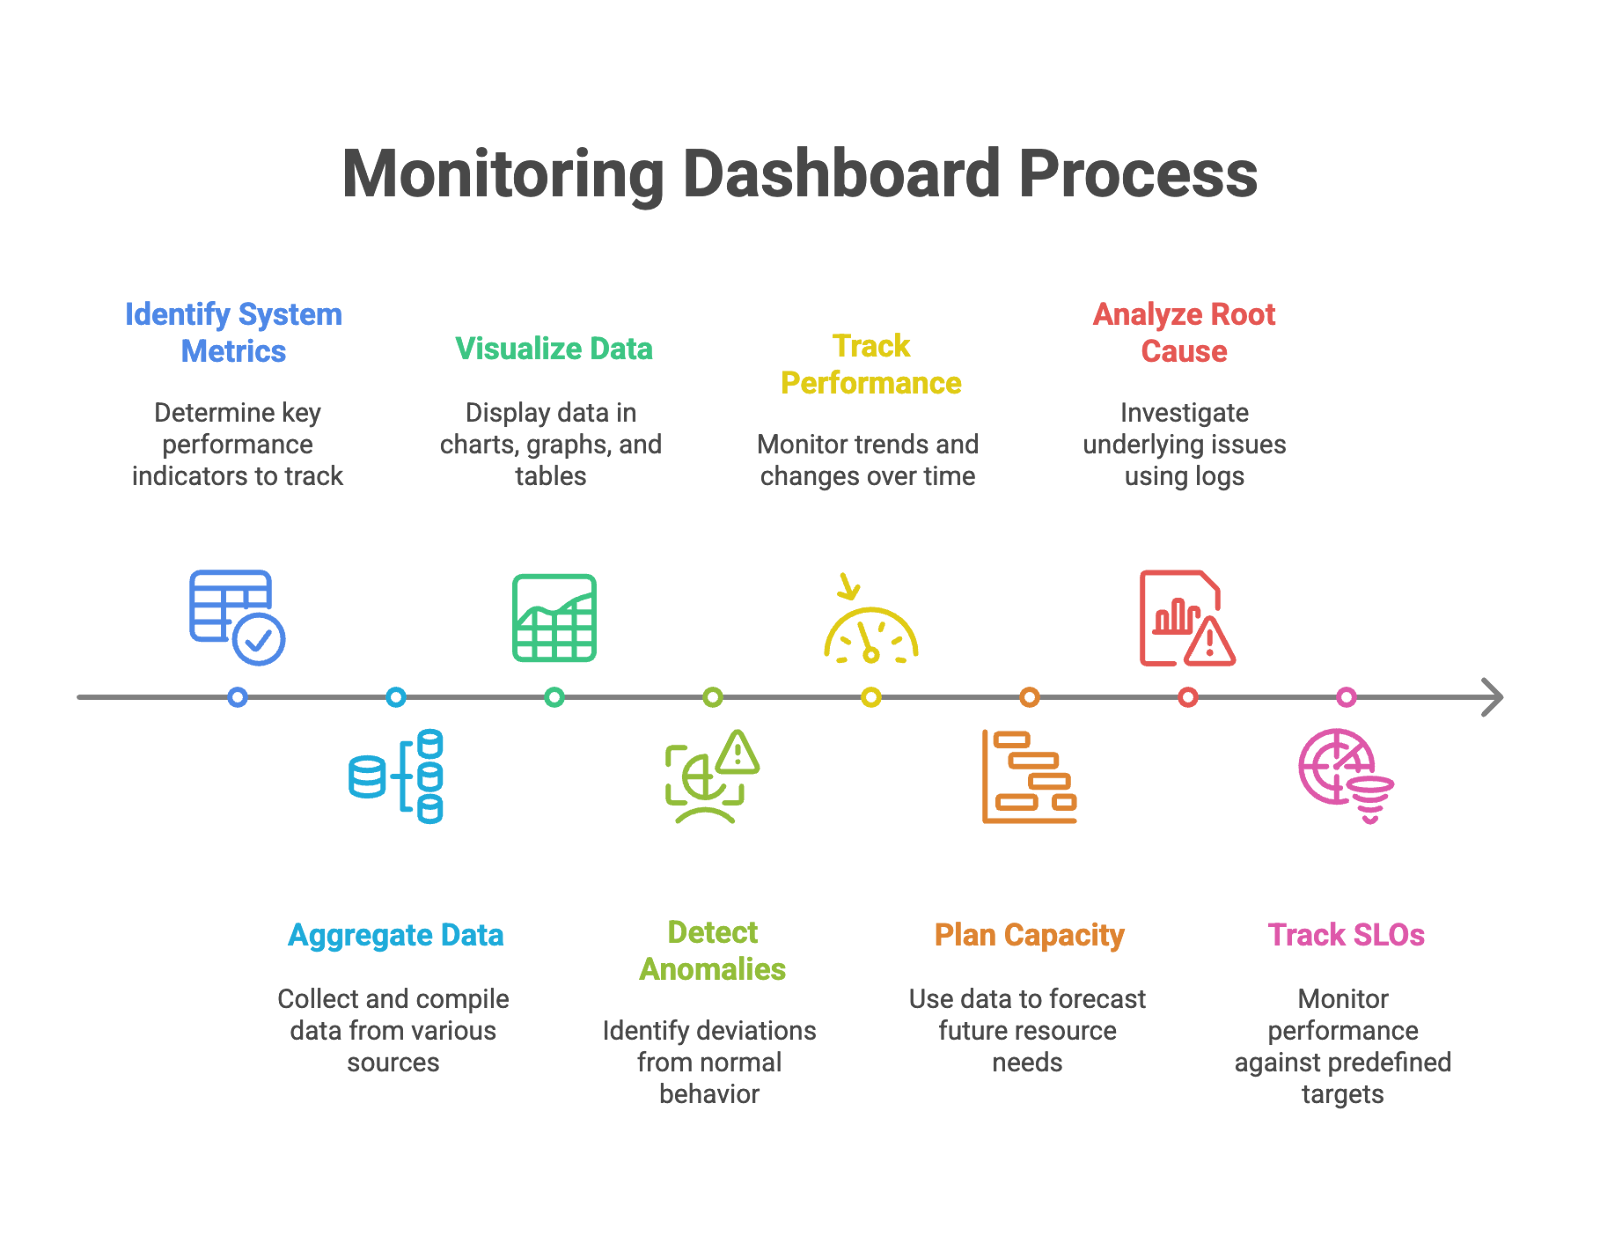
Dashboards typically consist of multiple panels, each visualizing a specific metric or aspect of the system. For example, a dashboard might include panels showing CPU utilization, memory consumption, network traffic, error rates, request latency, and throughput. These visualizations often come with thresholds and alerting capabilities, turning metric anomalies into actionable alerts. Beyond just displaying data, effective dashboards facilitate -
- Quick Problem Detection - Anomalies or deviations from normal behavior are immediately visible, indicating potential issues.
- Performance Tracking - Historical trends allow teams to understand how performance changes over time, identify degradation, or measure the impact of deployments.
- Capacity Planning - Resource utilization metrics help in planning for future growth and ensuring systems can handle the anticipated load.
- Root Cause Analysis (in conjunction with logs and traces) - While dashboards show what is happening, they often serve as the starting point for a deeper investigation using logs and traces to understand why.
- Service Level Objective (SLO) Tracking - Dashboards can display key metrics against predefined SLOs, indicating if the system is meeting its performance and reliability targets.
The design of a monitoring dashboard is crucial. It should be tailored to the specific needs of the users, prioritize the most important metrics, and present information in a clear and uncluttered manner. Tools like Grafana, Datadog, and CloudWatch provide flexible frameworks for building highly customizable dashboards that can adapt to the unique observability requirements of various applications, including the specialized demands of Large Language Models. These visual interfaces become the control center for operational teams, enabling proactive management and quick responses to any issues arising in complex production environments.
Importance of Real-time Monitoring for LLMs
Real-time monitoring is not merely a convenience but a fundamental necessity for managing Large Language Model applications in production. The dynamic, complex, and often black-box nature of LLMs, coupled with their direct impact on user experience and business operations, elevates real-time visibility to a critical level.
Firstly, immediate issue detection and response are paramount. LLM applications can exhibit sudden and unexpected behaviors, such as increased latency due to API rate limits, a surge in error rates, or a sudden rise in hallucinations if a new prompt variation is deployed. Real-time monitoring allows operational teams to detect these anomalies as they happen, enabling prompt investigation and intervention. Without real-time insights, issues could persist unnoticed for hours, leading to degraded user experience, loss of trust, and potential financial impact. For instance, if an LLM starts generating off-topic or nonsensical responses, real-time monitoring of response quality metrics can trigger an immediate alert, allowing engineers to roll back a problematic deployment or investigate the root cause before a significant portion of users are affected.
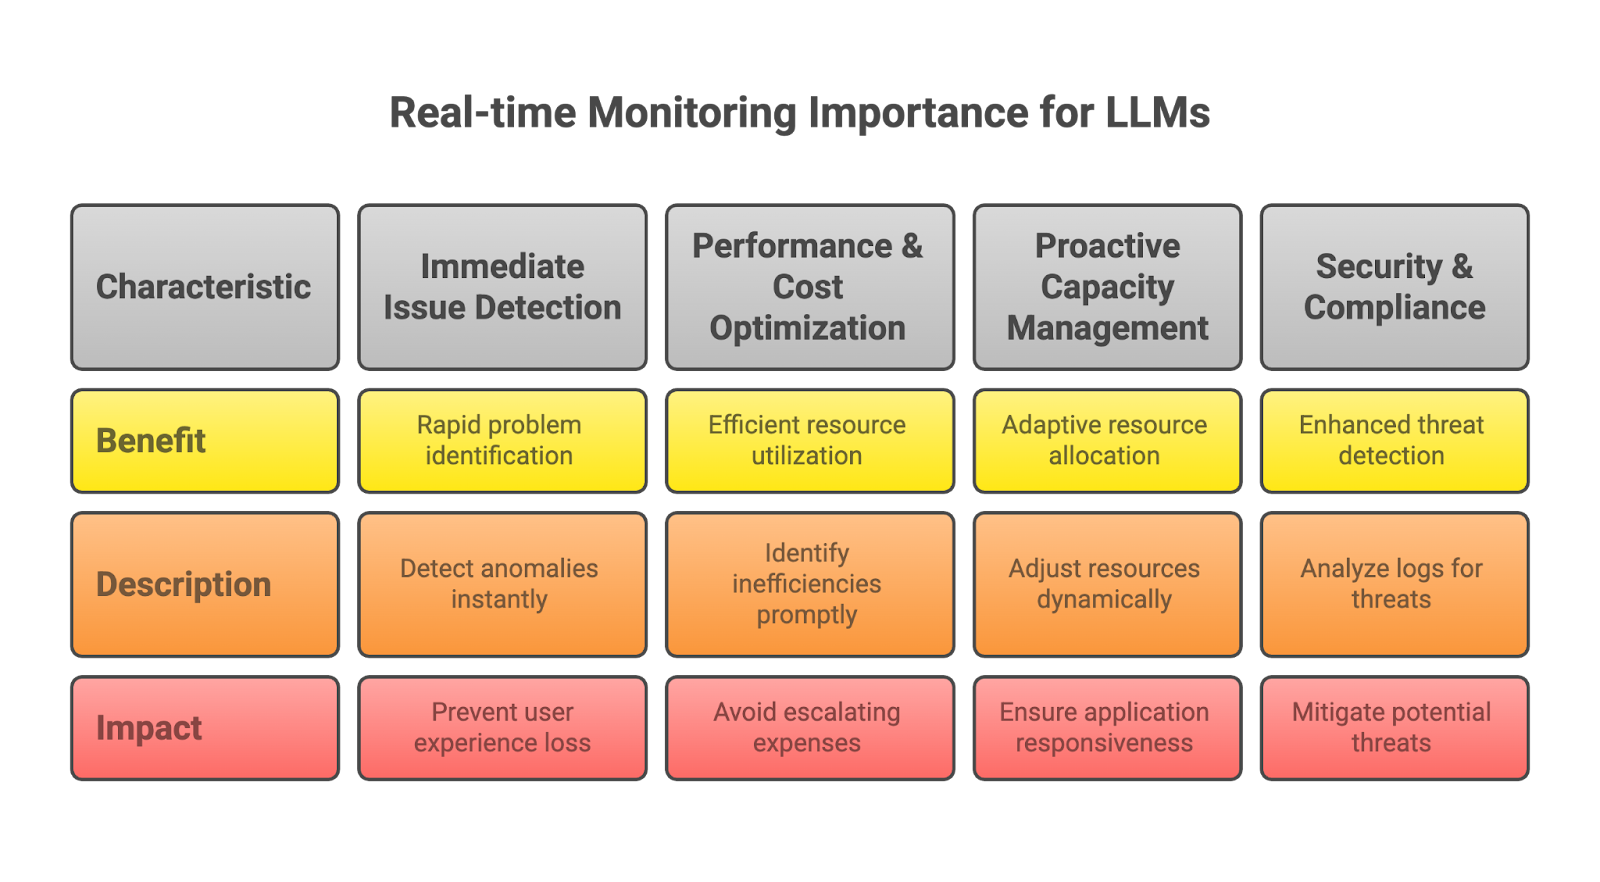
Secondly, performance and cost optimization require real-time feedback. LLM inferences are often priced per token, and inefficient prompt engineering or unexpected model behavior can lead to rapidly escalating costs. Real-time dashboards displaying token usage, latency per request, and throughput enable teams to identify and address cost inefficiencies or performance bottlenecks as they emerge. For example, a sudden spike in token usage for a particular type of query could indicate an unoptimized prompt or an agent stuck in a loop, which needs immediate attention to prevent runaway costs. By observing these metrics in real-time, adjustments can be made proactively.
Thirdly, real-time monitoring facilitates proactive capacity management. LLM applications can experience varying loads based on user demand. Real-time insights into request volumes, resource utilization (CPU, GPU, memory), and queue lengths allow infrastructure teams to scale resources up or down dynamically, ensuring the application remains responsive during peak times and cost-effective during off-peak periods. Without this real-time visibility, capacity planning becomes guesswork, potentially leading to over-provisioning or, worse, performance degradation and outages.
Finally, security and compliance benefit from real-time monitoring. Detecting unusual access patterns, repeated failed authentication attempts related to LLM APIs, or suspected prompt injection attacks requires immediate analysis of log and metric data. Real-time dashboards can highlight suspicious activities, enabling security teams to respond swiftly and mitigate potential threats. In summary, real-time monitoring provides the agility needed to operate LLM applications effectively in dynamic production environments. It empowers teams to quickly identify, diagnose, and resolve problems, optimize resource usage, manage costs, and maintain a high level of service quality, all of which are essential for the success and reliability of AI-driven systems.
Key Metrics to Monitor for LLMs
To effectively monitor Large Language Model applications, a specific set of metrics, beyond generic infrastructure metrics, needs to be tracked. These metrics provide insights into the LLM's operational health, performance, quality, and cost efficiency.
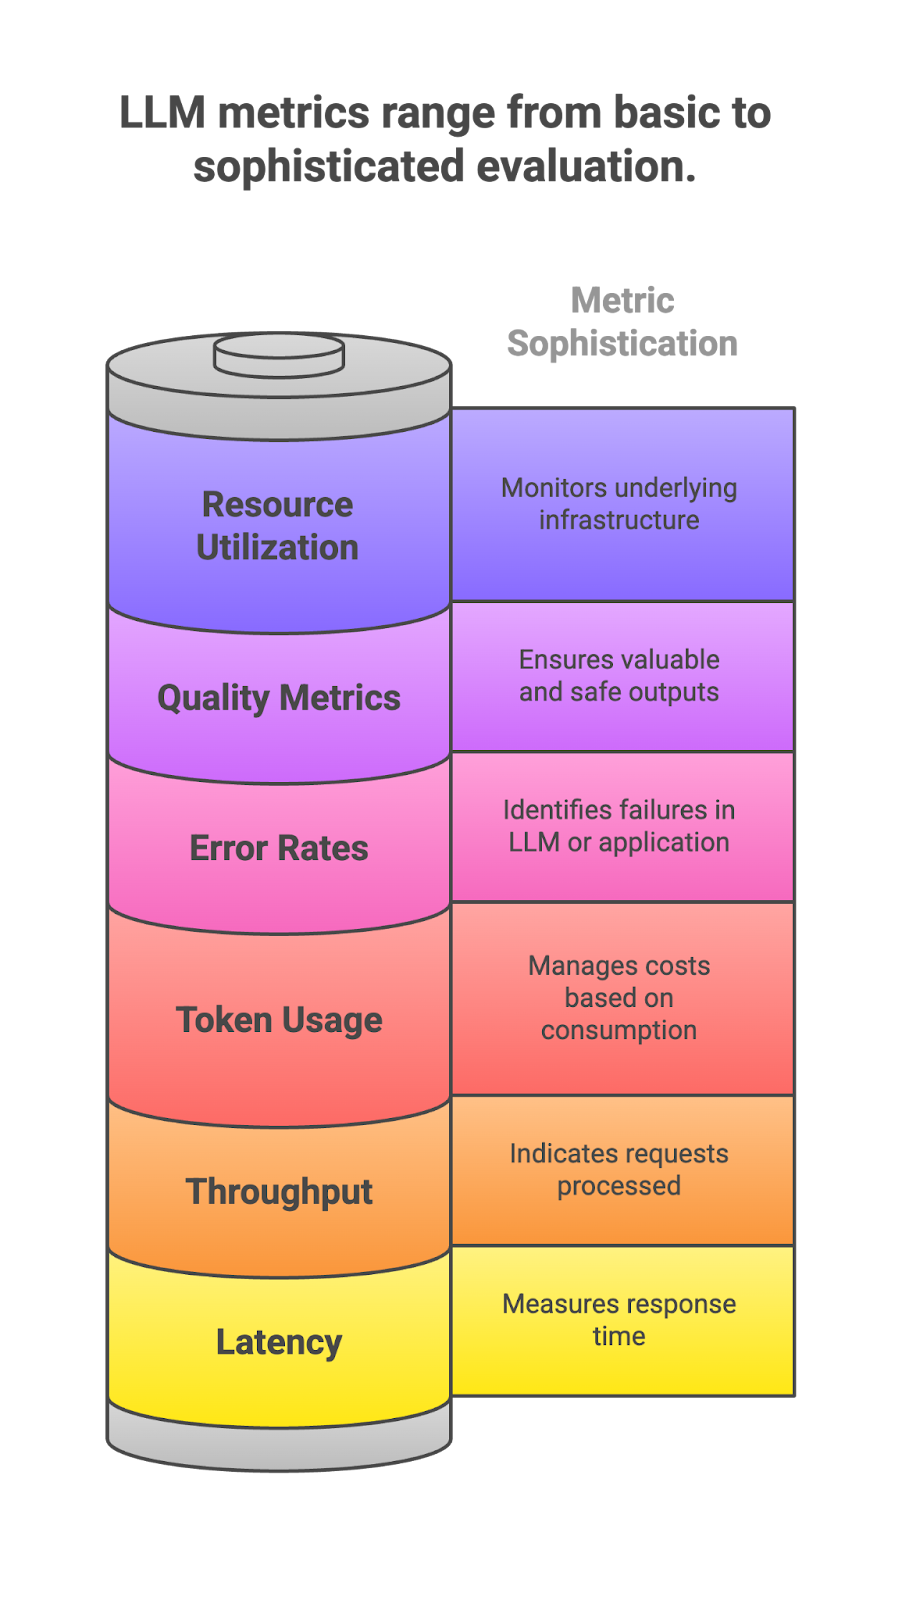
One of the most fundamental metrics is Latency. This measures the time it takes for the LLM to generate a response after receiving a prompt. Key latency metrics include -
- Total Response Latency - End-to-end time from user request to final application response.
- LLM API Latency - Time taken for the LLM provider's API to return a response.
- Per-Token Latency - Time taken to generate each token, which can indicate streaming performance. Monitoring these helps identify bottlenecks in the LLM call itself, network issues, or delays introduced by pre/post-processing steps.
Another critical metric is Throughput, which indicates the number of requests or prompts processed by the LLM application per unit of time (e.g., requests per second, tokens per second). High throughput, coupled with low latency, generally indicates a performant and scalable system. Tracking throughput helps in capacity planning and understanding the load on your LLM services.
Token Usage is arguably one of the most important cost-related metrics for LLMs. This involves -
- Input Tokens - The number of tokens in the prompt sent to the LLM.
- Output Tokens - The number of tokens in the LLM's generated response.
- Total Tokens - The sum of input and output tokens for a given interaction. Monitoring token usage is crucial for managing costs, as most LLM APIs charge based on token consumption. Spikes in token usage for specific prompts or user segments can indicate inefficient prompt engineering, verbose LLM responses, or agentic loops.
Error Rates are essential for identifying failures. This includes -
- LLM API Errors - Errors returned directly from the LLM provider (e.g., rate limit errors, invalid API key, model overloaded).
- Application-Level Errors - Errors within your application logic (e.g., failed parsing of LLM output, issues with retrieval from a vector database, timeouts during tool calls). Monitoring these provides immediate alerts when something is going wrong and helps pinpoint where the failure originates.
Beyond these operational metrics, Quality Metrics are vital, although some require more sophisticated evaluation -
- Hallucination Rate - The frequency with which the LLM generates factually incorrect information. This often requires automated or human-in-the-loop evaluation.
- Relevance/Coherence Score - How relevant and coherent the LLM's response is to the user's prompt and context.
- Factual Accuracy - For RAG systems, assessing if the answer is supported by the retrieved context.
- Safety/Bias Violations - Detecting instances of harmful, biased, or inappropriate content generation. These quality metrics help ensure the LLM is delivering valuable and safe outputs to users.
Finally, Resource Utilization (CPU, GPU, Memory) of the underlying infrastructure hosting your LLM application is also important, especially if you are running models on-premises or fine-tuning. For agentic systems, tracking Tool Call Success Rates and Agent Steps Taken can provide insights into their effectiveness and efficiency. By building dashboards around these key metrics, teams gain a comprehensive and actionable view of their LLM application's performance, allowing for proactive management and continuous improvement.
Popular Monitoring Dashboard Tools
Several powerful monitoring tools are widely used to create dashboards for various applications, and they are increasingly adapting to the unique requirements of Large Language Model observability. These tools provide the infrastructure for collecting, storing, processing, and visualizing the key metrics discussed previously.
Grafana
Grafana is an open-source platform for monitoring and observability, renowned for its highly customizable and interactive dashboards. It is not a data collection tool itself but rather a powerful visualization layer that integrates with a wide variety of data sources. This flexibility makes Grafana an excellent choice for LLM monitoring, as it can pull metrics from diverse systems where LLM applications reside.
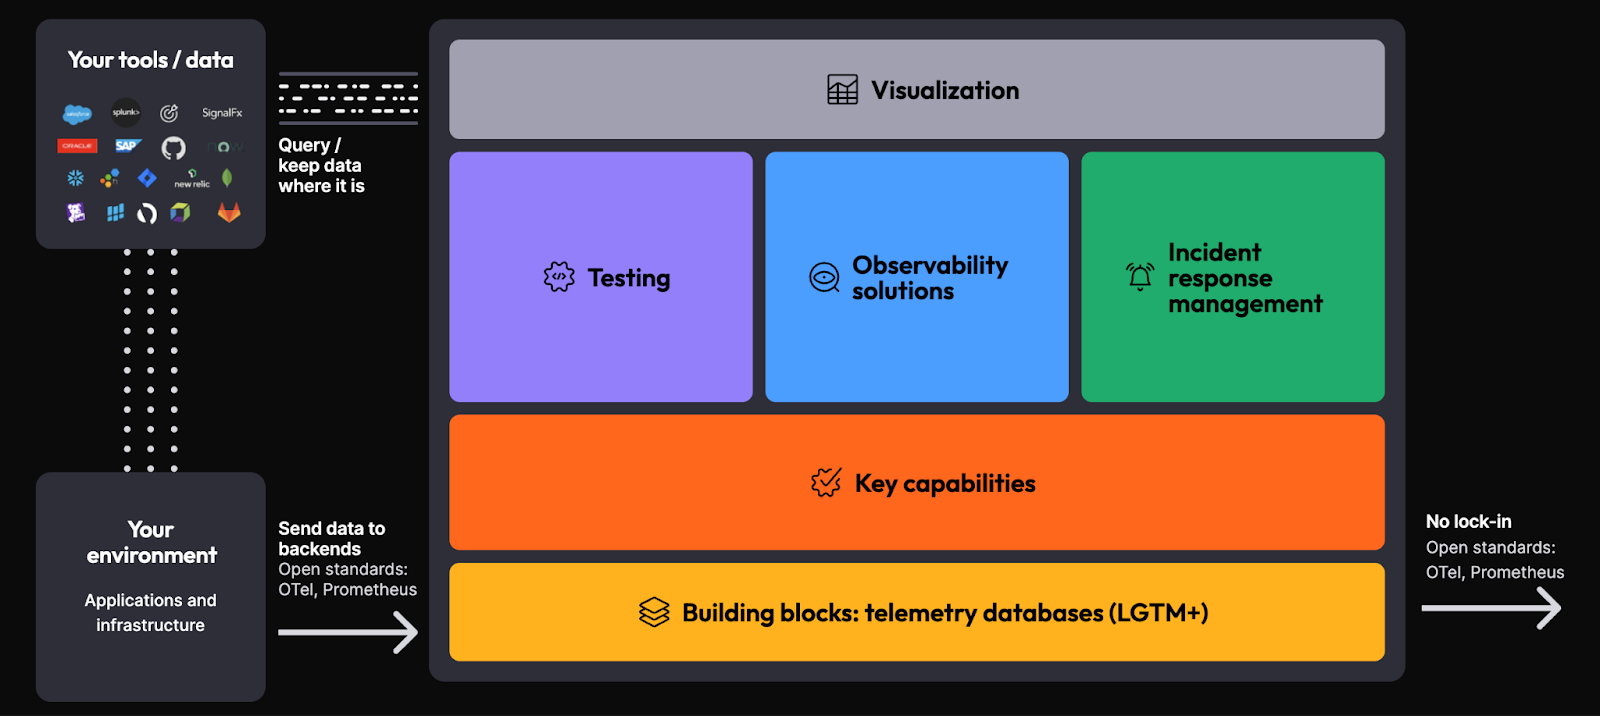
Grafana Stack - Image Source
For LLM observability, Grafana can connect to various data sources that store your LLM-related metrics and logs. Common integrations include -
- Prometheus - A popular open-source monitoring system that collects and stores time-series data. Your LLM application can expose metrics (e.g., llm_request_latency_seconds, llm_token_usage_total, llm_error_count) in a Prometheus-compatible format, which Prometheus scrapes and then Grafana queries.
- Elasticsearch - If you're using the ELK Stack for centralized logging, Grafana can directly query Elasticsearch to visualize aggregated log data as metrics (e.g., count of errors over time, average latency from log timestamps).
- Databases - Any time-series database (e.g., InfluxDB, PostgreSQL with TimescaleDB extension) or even relational databases storing custom LLM metrics can be connected to Grafana.
- Cloud Providers - Grafana has plugins for cloud monitoring services like AWS CloudWatch, Google Cloud Monitoring, and Azure Monitor, allowing you to visualize LLM metrics collected by these services if your LLM application is deployed in the cloud.
Grafana's strength lies in its rich visualization options and dashboard flexibility. You can create panels with line graphs to track latency over time, bar charts to show token usage breakdown by model, heatmaps to visualize response time distributions, and tables to display error summaries. Its templating features allow for dynamic dashboards where you can select specific model versions, user IDs, or time ranges, making it easy to drill down into specific data. Furthermore, Grafana supports alerting, allowing you to configure notification channels (e.g., Slack, email, PagerDuty) to be triggered when specific metric thresholds are crossed (e.g., LLM error rate exceeds 5%, average latency spikes). This proactive alerting is crucial for immediate incident response in LLM applications. The open-source nature and large community support make Grafana a powerful and cost-effective solution for building sophisticated LLM monitoring dashboards, providing comprehensive visibility across your entire LLM ecosystem.
Datadog
Datadog is a comprehensive SaaS-based monitoring and analytics platform that offers end-to-end visibility across infrastructure, applications, logs, and network performance. It has rapidly evolved to include specialized features for Machine Learning and Large Language Model observability, making it a strong contender for organizations seeking a unified observability solution.
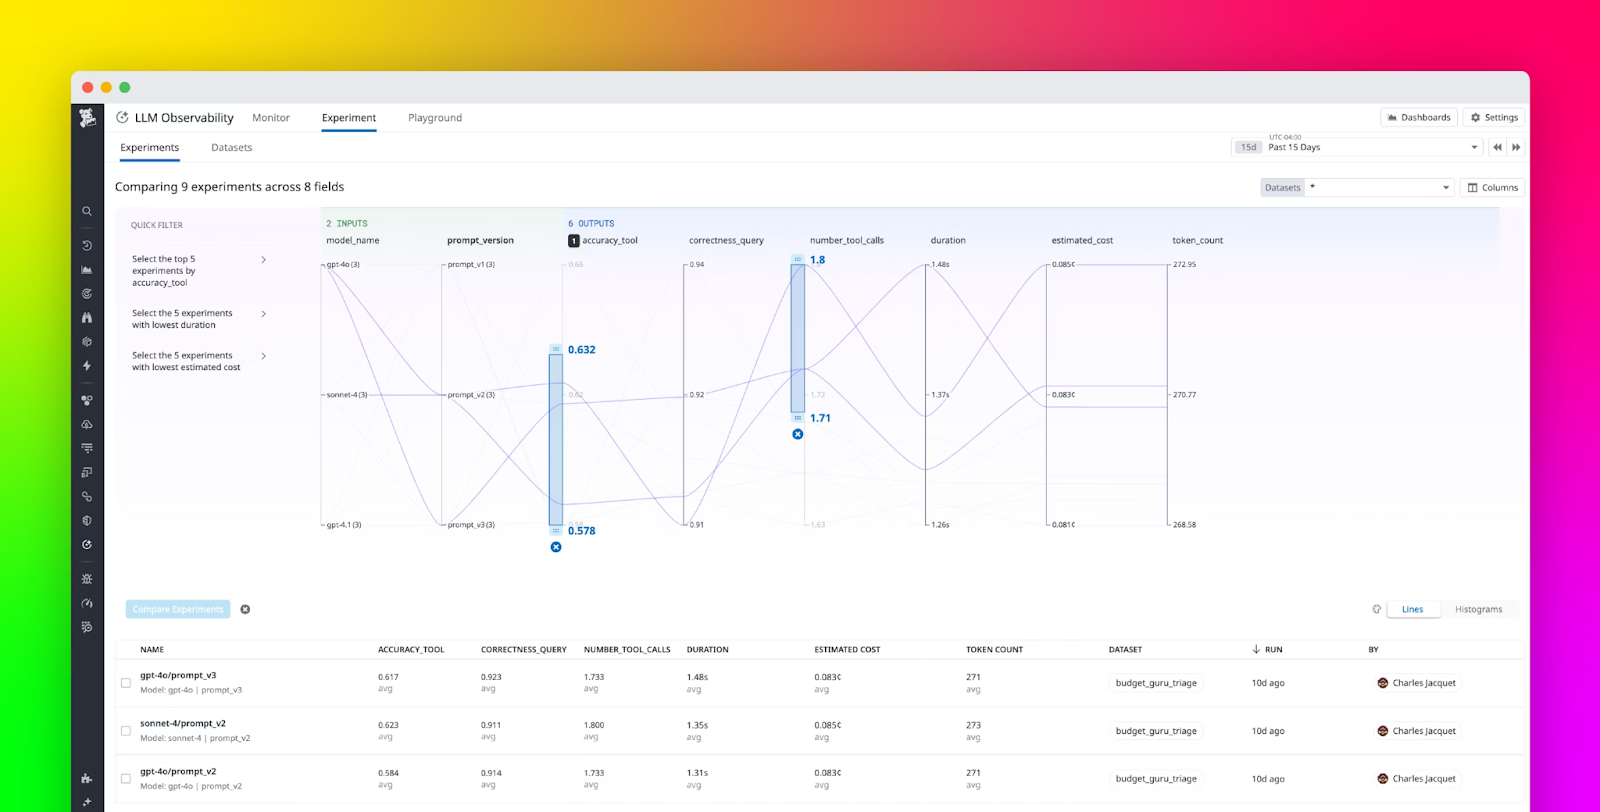
Datadog - Image Source
For LLM applications, Datadog provides a robust set of capabilities -
- Integrated LLM Observability - Datadog offers specific integrations and features tailored for LLMs. It can automatically collect metrics and traces from popular LLM providers (like OpenAI) and frameworks (like LangChain) through its agents and SDKs. This means you get out-of-the-box visibility into LLM calls without extensive custom instrumentation.
- End-to-End Tracing - Similar to dedicated tracing tools, Datadog provides full end-to-end tracing of LLM chains and agentic systems. You can visualize the flow of requests, including inputs and outputs at each step, tool calls, and agent-to-agent interactions. This helps in quickly identifying bottlenecks, pinpointing errors within complex LLM workflows, and understanding the reasoning path of your agents. Datadog's ability to correlate these LLM-specific traces with traditional APM (Application Performance Monitoring) traces means you can see the full picture, from the user's browser request down to the LLM call and database queries.
- Comprehensive Metrics Collection - Datadog collects and allows you to monitor all key LLM metrics, including: Latency (LLM API response time, end-to-end latency), Token Usage (input, output, total, and associated costs), Throughput (requests per second, tokens per second), Error Rates (LLM API errors, application errors), Resource Utilization (CPU, memory, GPU for self-hosted models)
- Customizable Dashboards - Datadog's dashboarding capabilities are highly flexible. You can create custom dashboards to visualize all your LLM metrics in real-time, set up alerts based on predefined thresholds or anomaly detection, and create reports. For instance, you could have a dashboard showing daily token expenditure, a live graph of LLM API errors, or a breakdown of hallucination rates by model version.
- Quality and Security Evaluations - Datadog integrates features for assessing LLM quality, such as detecting hallucinations in RAG applications and monitoring for PII leaks. It also provides tools for detecting security risks like prompt injection attempts, offering guardrails to protect your LLM applications.
- Log Management - Datadog's log management solution centralizes all your LLM application logs, allowing for powerful searching, filtering, and analysis alongside your metrics and traces. Logs are automatically parsed and enriched, making it easier to extract valuable information.
Datadog's unified platform approach means you get a holistic view of your LLM application's performance, health, and security in one place. Its ease of setup, extensive integrations, and advanced features make it a powerful, albeit commercial, solution for robust LLM observability at scale.
AWS CloudWatch
AWS CloudWatch is a monitoring and observability service built for Amazon Web Services (AWS) resources and applications running on AWS. If your LLM application is deployed within the AWS ecosystem (e.g., using Amazon Sagemaker, Lambda, EC2 instances, or interacting with Amazon Bedrock), CloudWatch provides native and integrated monitoring capabilities that are essential for observability.
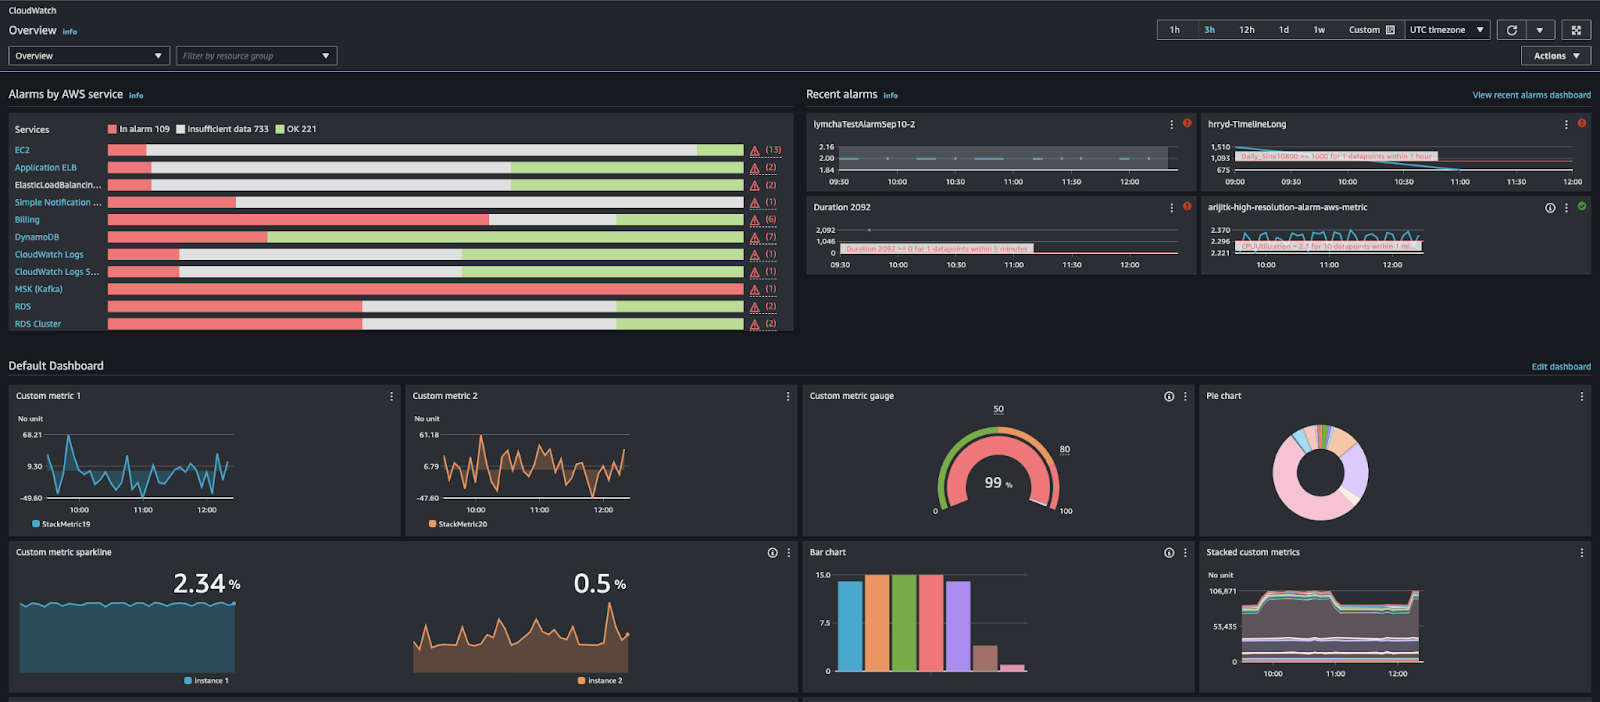
AWS CloudWatch - Image Source
CloudWatch primarily operates on three types of data -
- Metrics - It collects and tracks metrics for AWS resources (e.g., CPU utilization for EC2 instances, invocation counts for Lambda functions, latency for API Gateway). For LLM applications, you can also publish custom metrics to CloudWatch from your application code. This is how you would track LLM-specific metrics like llm_api_latency_ms, llm_token_count_input, llm_error_rate, or rag_retrieval_time_ms.
- Logs - CloudWatch Logs allows you to centralize logs from all your AWS resources and applications. This means your LLM application's logs (whether from Lambda functions, EC2 instances, or container services) can be streamed to CloudWatch Logs. Once ingested, you can search, filter, and analyze these logs, and even create metrics filters to extract numerical data from log patterns (e.g., count occurrences of "HALLUCINATION DETECTED" in logs).
- Events - CloudWatch Events (now integrated with Amazon EventBridge) delivers a near real-time stream of system events that describe changes in AWS resources. While less direct for LLM application performance, it can be useful for triggering actions based on resource state changes that might affect your LLM application.
For LLM monitoring, CloudWatch allows you to create customizable dashboards that display these metrics and log data. You can build dashboards showing the health of your infrastructure hosting the LLM, alongside performance metrics of the LLM application itself. For example, a dashboard might include -
- Graphs showing the average latency of your LLM endpoint.
- Bar charts illustrating daily token consumption from your LLM API calls.
- Widgets displaying the error rate of your Lambda functions serving LLM inferences.
- Log groups showing real-time streams of LLM application errors or suspicious activities.
CloudWatch also features Alarms, enabling you to set thresholds on any metric and trigger notifications (via Amazon SNS) or automated actions (e.g., scaling EC2 instances, invoking Lambda functions) when those thresholds are breached. This allows for proactive incident management. For instance, an alarm could be set to notify you if your llm_api_latency_ms exceeds a certain value for a sustained period or if your llm_error_rate climbs above a defined percentage. Its deep integration with other AWS services makes it a natural choice for organizations operating their LLM workloads predominantly on AWS, providing seamless monitoring and operational insights within their cloud environment. While it might require more manual setup for custom LLM metrics compared to specialized LLM observability platforms, its native integration and scalability within AWS are significant advantages.
Final Words
In today’s AI-driven environments, monitoring dashboards have evolved from convenient visualization tools into mission-critical control systems. By consolidating metrics, logs, and traces into intuitive, real-time views, they empower teams to detect anomalies faster, diagnose issues with greater precision, and optimize both performance and cost. This becomes especially vital in the context of Large Language Models, where behavior can shift rapidly, workloads fluctuate, and quality, safety, and reliability must be continuously assured.
Organizations that invest in thoughtful dashboard design, selecting the right metrics, implementing meaningful alerts, and leveraging platforms such as Grafana, Datadog, and AWS CloudWatch, gain the operational visibility required to keep complex LLM applications stable, secure, and efficient. Ultimately, effective monitoring is not simply about observing systems; it is about enabling proactive decision-making, minimizing risk, and sustaining user trust as AI systems scale in scope and impact.
References