
Ever felt the frustration of a “no-code” solution still demanding database setup, API keys, and a hefty dose of technical know-how? While many tools promise “vibe coding,” they often just shift the code around. This guide introduces “vibe-working”, a truly hands-on approach where turning data into action is as simple as a conversation. Forget complex configurations; with vibe-working, you just chat and go.
Teable transforms how we interact with data, moving beyond traditional storage to an intelligent database agent that comprehends, reasons, and acts upon information. It eradicates the common burden of disparate data sources and cluttered dashboards, turning raw data into an actionable asset. This guide will explore Teable’s end-to-end capabilities, demonstrating how it ingests complex data and leverages AI to generate meaningful insights, power automations, and even build custom applications. To begin, users simply sign up, create a workspace resembling a hybrid of Airtable and an AI copilot, and effortlessly load data from various sources like CSVs, APIs, or databases.
Teable homepage
Teable distinguishes itself by moving beyond mere data retrieval to enable powerful, automated actions. Its core capabilities center on intelligent data manipulation and proactive task execution. For instance, Teable can dynamically perform customer segmentation, allowing users to simply prompt for classifications like “VIP, Regular, and At-risk” based on specific metrics like lifetime value and purchase frequency, ensuring these segments are continuously updated. Furthermore, it facilitates real-time inventory alerts, such as configuring Slack notifications when stock levels fall below a set threshold, leveraging built-in integrations. Teable also streamlines reporting by handling scheduled deliveries of customized summaries, like weekly sales or churned customer reports, directly to your email, demonstrating its capacity for sophisticated automation without complex setups.
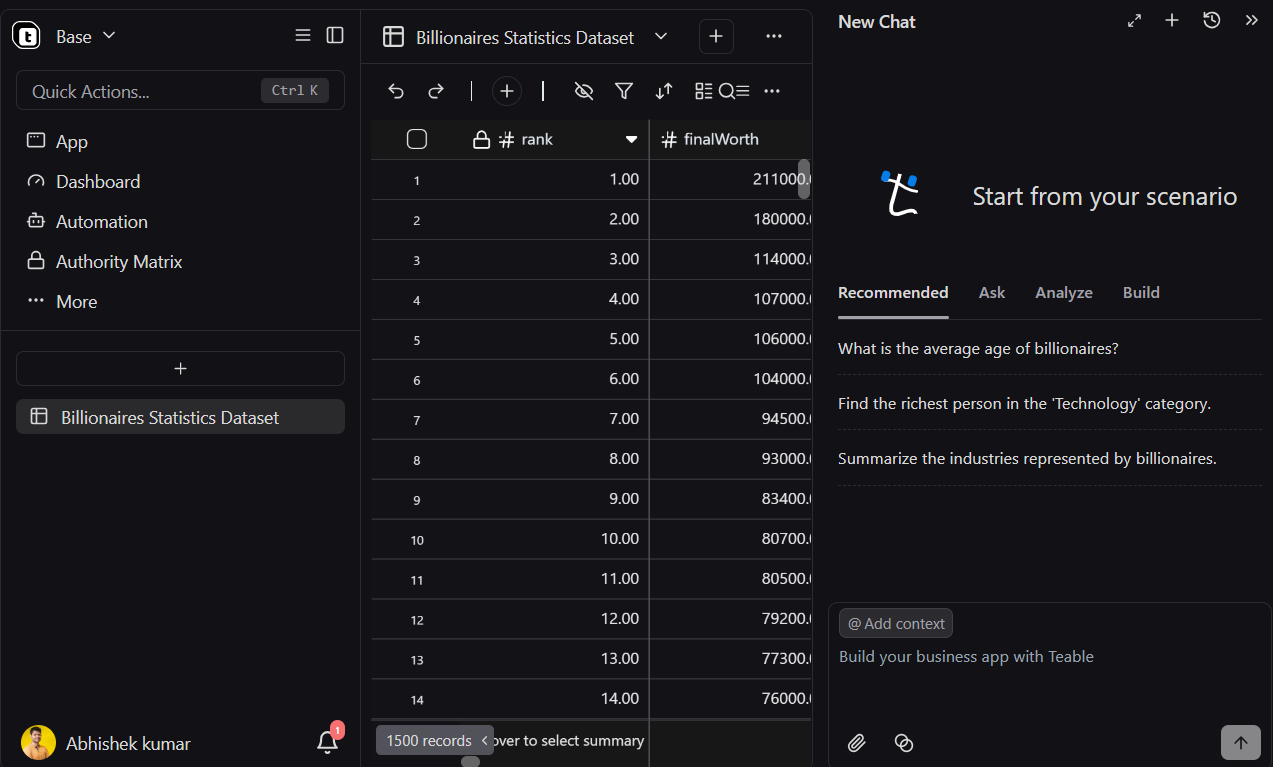
Loading a sample CSV file
When it comes to querying, Teable truly shines by transforming complex data exploration into an intuitive, conversational experience. As shown below with the Billionaires Statistics Dataset, users can pose natural language questions like “Find the richest person in the technology industry” instead of writing intricate SQL.
When it comes to querying, Teable truly shines by transforming complex data exploration into an intuitive, conversational experience. As shown below with the Billionaires Statistics Dataset, users can pose natural language questions like “Find the richest person in the technology industry” instead of writing intricate SQL.
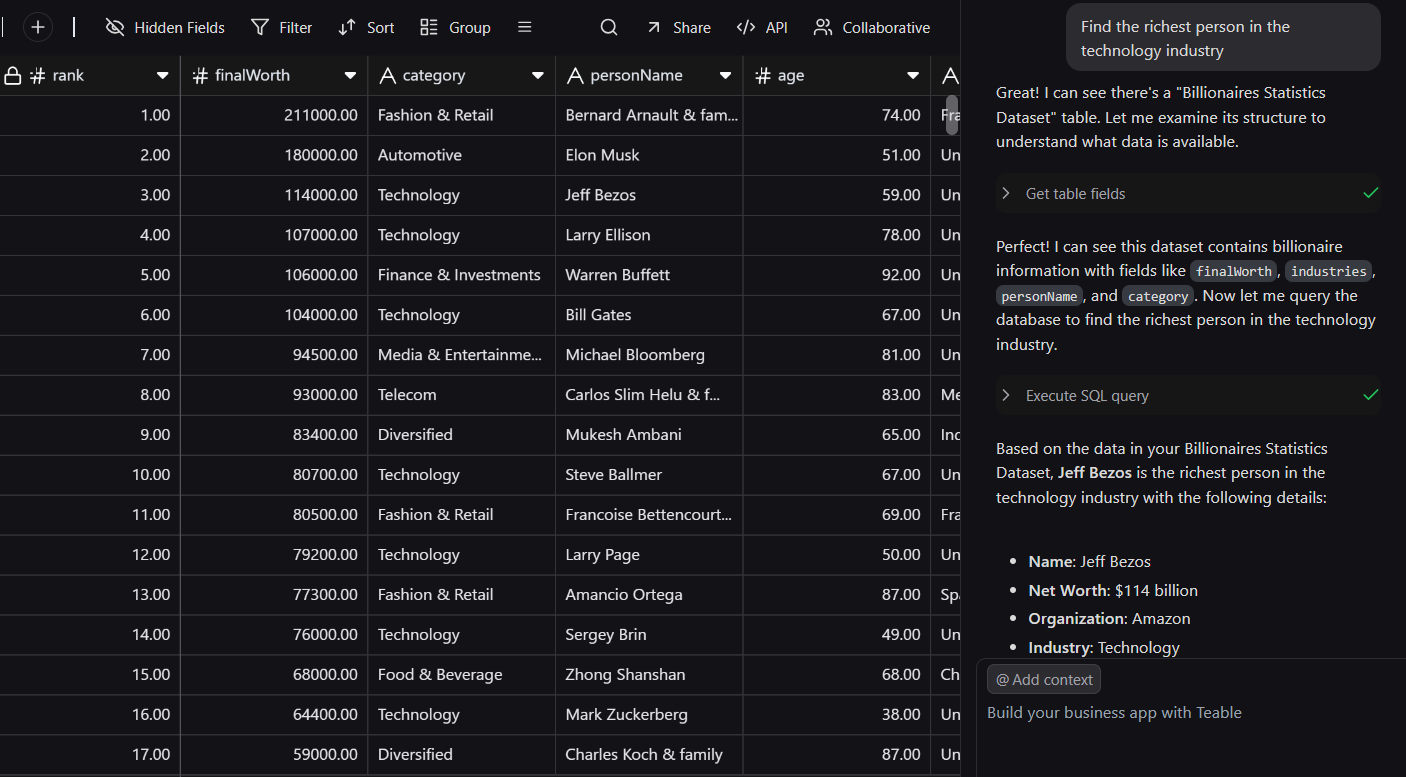
Testing SQL queries
Behind the scenes, Teable’s intelligent LLM translates these prompts into precise SQL queries, executing them against your database. What’s remarkable is its ability to infer context; even if a specific column like “Net Worth” isn’t explicitly mentioned, Teable understands its relevance to “richest person,” delivering accurate, human-friendly results instantly. This capability democratizes data analysis, making sophisticated insights accessible to everyone.
Teable elevates data visualization by allowing users to create interactive charts and graphs with simple, natural language prompts. Beyond just visuals, it intelligently provides key inferences directly from your data, making complex patterns easily digestible. This intuitive approach means you don’t just see the data; you understand its implications. With a well-crafted prompt, Teable’s capabilities can be extrapolated to generate comprehensive, full-fledged dashboards, offering dynamic and actionable views of your most critical metrics. It transforms raw data into a powerful narrative, enabling swift, informed decision-making.
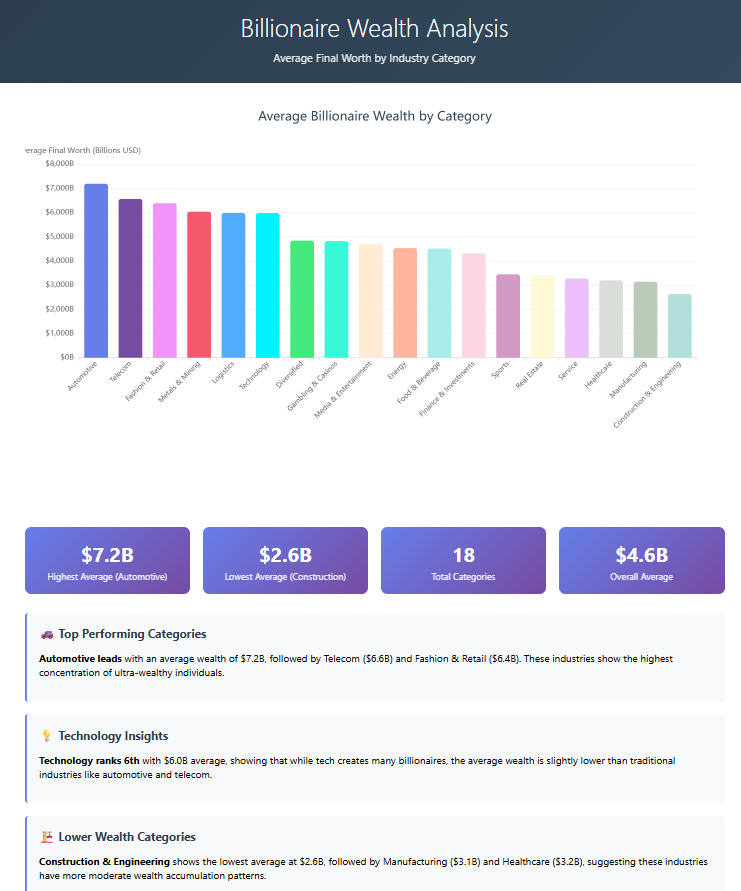
Sample chart generation
Teable extends far beyond mere visualization, empowering users to build interactive, data-driven applications with remarkable ease. Imagine crafting a custom app where users can dynamically select categorical and numerical features from dropdowns, specify chart types and aggregation methods, and instantly generate tailored visualizations. This hands-on capability transforms Teable from an analytical tool into a versatile development platform. It allows you to expose specific data functionalities to end-users in a controlled, intuitive interface, unlocking new possibilities for internal tools, client portals, or even public-facing utilities, all built atop your intelligently managed data.
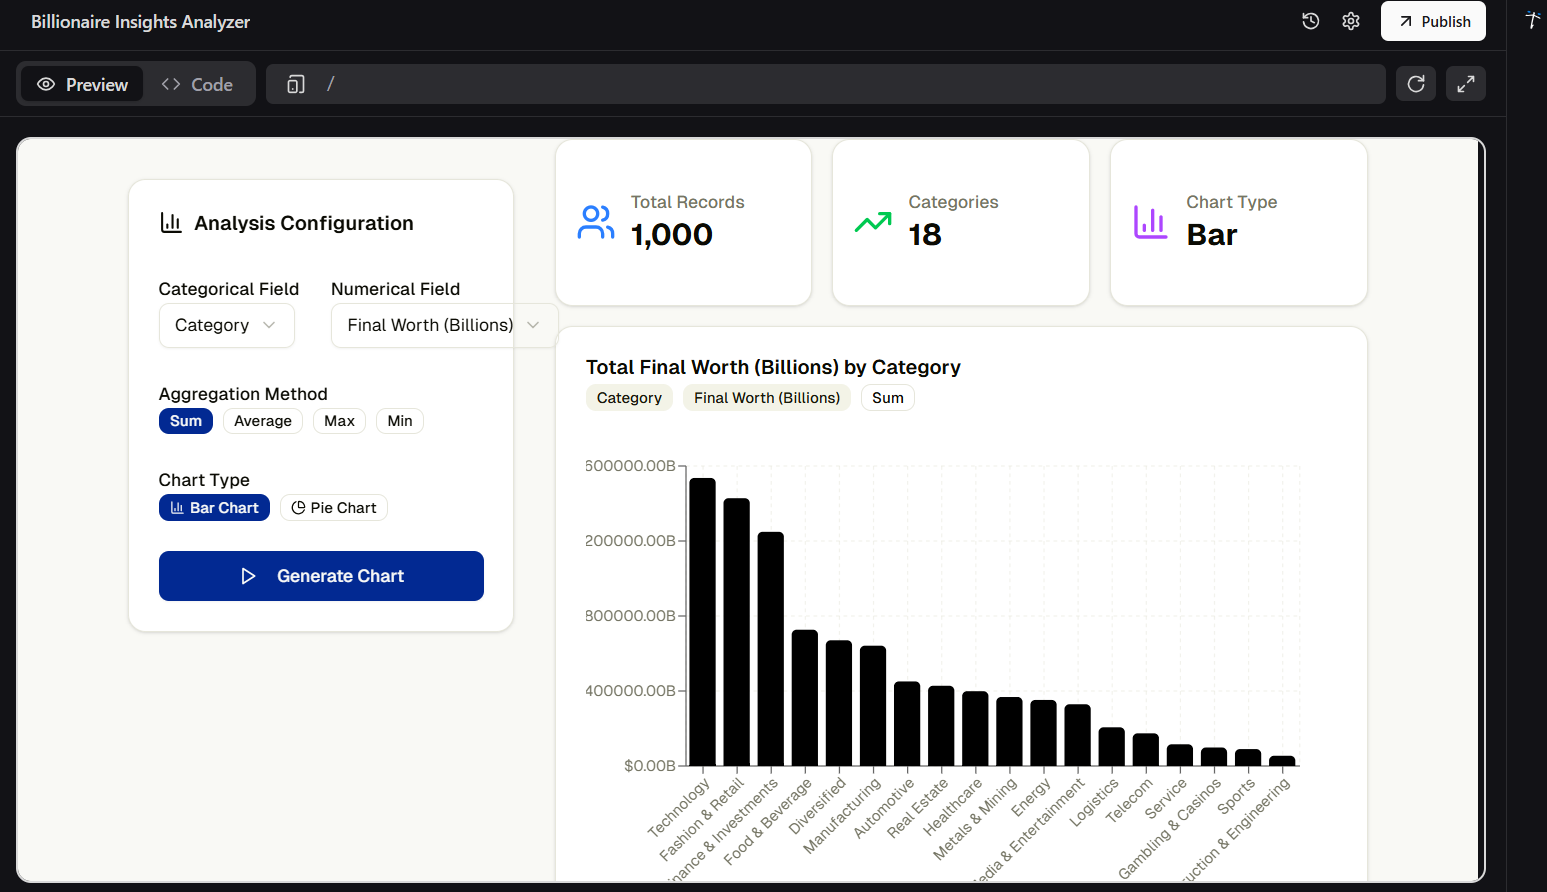
An application built on the uploaded dataset
Teable stands apart through its ‘data-first’ approach, a significant differentiator from many “vibe coding” platforms that prioritize front-end aesthetics while relegating data handling to an afterthought. This common oversight often leads to scalability issues and technical debt. In contrast, Teable’s foundation is built on understanding and managing your data intelligently from the ground up. By centering its capabilities around the data itself, Teable ensures a robust, flexible, and truly powerful backend that seamlessly supports sophisticated insights, automations, and application development, avoiding future complexities and delivering genuine efficiency.
Teable is more than just a tool. It’s a shift in how we think about working with data. By combining intelligence, simplicity, and action, it removes the barriers that keep insights locked away. With vibe-working, you don’t just analyze, but you create, automate, and innovate with ease. Whether you’re exploring data for insights or building applications that drive impact, Teable empowers you to turn possibilities into reality. Now it’s your turn to dive in and make data work for you.


![[Upcoming Webinar] Autonomous Enterprises: How to leverage Agentic AI in Enterprises?](https://adasci.org/wp-content/uploads/2025/10/Adasci-Webinar-1-300x300.png)